 |
|
|
|
|
|
|
|
|
|
|
 |
|
July 24, 2008
MBLWHOI Library Develops Taxonomy Toy
By Joseph Caputo
|
 |
|
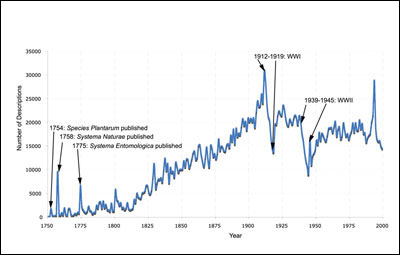
The number of descriptions (y-axis) are shown for every year between 1750 and 2000 (x-axis). Significant historical events that coincide with noticeable changes in year-to-year trends are noted with arrows. Credit: I.N. Sarkar, R. Schenk and C.N. Norton/BioMed Central - Click for full size image
|
MBL, WOODS HOLE, MA—Cathy Norton may be on to something: Bioinformatics toys for scientists. Sure, they won’t be as popular as Super Soakers or Frisbees, but hers is a niche audience. Currently on the market is Taxatoy, a computer interface that lets users create customizable graphs to depict the number and variety of species discovered since 1750, when the Latin classification system developed by Carl Linnaeus began. (Using the program, one can learn that out of the nearly 2.3 million listed species, 31 are lobsters). The tool was developed by the MBLWHOI Library in 2007 and is now freely accessible online.
According to Norton, who directs the MBLWHOI Library, the idea for Taxatoy came out a steering committee meeting for the Encyclopedia of Life. Chair James Hanken, a herpetologist, wanted to know how many books on snakes were out there. “Everyone kind of stared and said. ‘We’re not sure how to do that,’” Norton recalls.
After thinking about the problem, she asked Indra Neil Sarkar, Informatics Manager at the MBLWHOI Library, to figure out how many new species were described before 1923, the year at which copyright restrictions begin in the United States. Using uBio, a catalog of known names of all living (and once-living) organisms pre- and post 1923, Sarkar imported each species name, who first assigned it, and what year. With this information he and Ryan Schenk, who assisted with the project, designed Taxatoy out of an Excel workbook.
In a paper published online at BioMed Central in May 2008, Sarkar, Schenk, and Norton explored historical trends first visible through Taxatoy. A plot of all species described between 1750 and 2000 revealed spikes of discovery in 1754, 1758, and 1775. These dates can be correlated with the respective publication dates of Species Plantarum, Systema Naturae, and Systema Entomologica, the three major works of Carl Linnaeus, the father of modern taxonomy. The graph also showed that while the number of new species described overall declined during the World Wars, which might warrant further investigations into relationships between conflicts and their impact on taxonomic science. “When you start looking at it, suddenly you see new and different patterns,” Norton says. “That’s the excitement of building any bioinformatics tool.”
Although Taxatoy began as a librarian’s way to answer a specific question, it turned into a tool to actually ask questions and get many answers. “It’s interesting for environmental conservation reasons as well,” Sarkar says. “One may want to know if a particular taxonomic group is well described or under-described - Should I bother looking for more of these?”
He also sees educational applications. “I can imagine a fifth-grade quiz question: Why do you think bacteria are only available after 1910?” Sarkar adds. “Well, the logical answer is that’s the year the modern microscope became popular.”
However people are using Taxatoy, it’s a hit at BioMed Central. The paper describing historical trends quickly became one of the site’s top-accessed articles of 2008. Try it out at http://taxatoy.ubio.org.
|
| |
|
|
|
|
|

